Couple Charts
Going to look at a couple charts tonight as no one else seems to want to............(I follow several different blogs and market commentary services and very few are analyzing the financials short right now, although a few are looking at the long position in gold). I will go ahead and step up to the plate here and see what I can come up with.
Disclaimer: I am an awful chartist / TA guy - just doing this to spice stuff up.
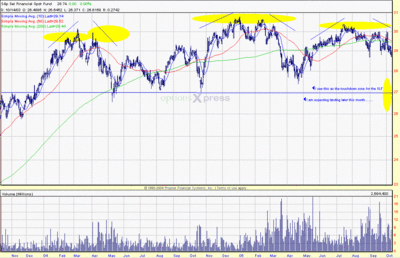
I own the PUTS on XLF (the ETF covering the financial sector). This means that I have negative / bearish outlook on this sector of the market. So far it has moved down a little since I purchased it, but nothing significant. Here is the chart:

Re: above - I see sunnier skies around $27.
I own the CALLS on NEM ( Newmont mines - the gold miner). This means that I have a positive/bullish outlook on this stock. So far it has moved up a little since I purchased it but nothing really big. Here is the chart:
 Will it break $50 in this cycle? Doesn't look like it on the chart, but I am optimistic.
Regards,
BG
![[Most Recent Quotes from www.kitco.com]](http://www.kitconet.com/images/live/s_gold.gif)
![[Most Recent Quotes from www.kitco.com]](http://www.kitconet.com/images/live/s_silv.gif)

0 Comments:
Post a Comment
<< Home