![[Most Recent Quotes from www.kitco.com]](http://www.kitconet.com/images/live/s_gold.gif)
![[Most Recent Quotes from www.kitco.com]](http://www.kitconet.com/images/live/s_silv.gif)

A Special Trick or Treat
(Portfolio specific notes) - Today marked a 5 month low in the portfolio for me. I have really gotten nailed on the XLF short and I am not sure if it will come back within my time horizon. All I can say - is thank god that I left 50% of cash in the portfolio when I decided to do my gold speculation or I might have been wiped out. I have noticed in general that I tend to be early in things. I was early in buying SNDK and left early (although I understood the bullish story), I was short early in homebuilders and left too early (but apparently understood the fundamentals relationship). I was early in gold and left, but then shouldn't have gone back or......should have held original positions ( I don't claim to understand what is going on there - too much static).
General article:
Anyways this is the basic point - I think that the performance of the financials is important here, not just for my own portfolio but also as a tell for the rest of the market. I do not understand the present action in the financials, but I do think that I understand the historical relationship between a flattening yield curve and/or rising interest rates - and the performance of the financials. Right now many traders/investors are fleeing to the "stability" of the financials. I think that is a false perception. Let me qualify that - I think investors see attractive dividend yields and relatively non-volatile stock prices over the past 3 years (in the XLF) and think that is one area of the market where they can find safety.
However, my thinking is that confidence is built on a shaky foundation. Mainly on unsustainable growth/extension of credit to debtors at the margin and shaky collateral values that back this credit - mainly in the form of paper "equity" in real property subject to significant mortgage debts - often at variable rates, etc. As this boom cycle ends (we are really just beginning the end I believe) - I think we will enter a debt liquidation cycle that dwarfs what we saw during the S&L period of the late 1980s. Anyways.....I am getting ahead of myself - we have seen very few cracks in the armor of the financials - while the market as a whole has seemed quite shaky. Up 100 points, down 100 points, up, down, up, down. I think that if/when the financials finally fold the market will be able to find a real bottom. Whether that bottom is at 9800, 9200, or 8000 on the DJIA - I don't know. Remember that XLF is nearings all time highs as we speak - closing today at $30.31 and heading higher towards its $30.79 peak. So maybe the better question is where does it top. Lets instead study the divergence which is significant.
The basic charts that I have assembled study the short term divergence of the financials sector of the market (mainly - Brokers and Banks) v. their historical trends/correlations with both housing sector and also treasuries pricing. I think some significant divergences have formed over the course of the past five years in both, but that divergence has been corrected within the month-to-month time frame and certainly on the yearly timeframe. This statistical sampling may be insignificant as it spans less than 5 years for both. Still here are some of the charts and graphs which show where we are at.
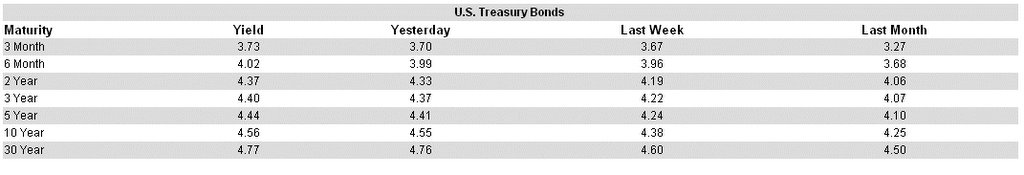
First, we will look at what the yield curve is doing currently. Today longer term yields stabilized, but the yields on the 2-10 year maturities continued to rise - flattening the yield curve:
 Here is the longer term correlation between the treasuries prices and the financials pricing:
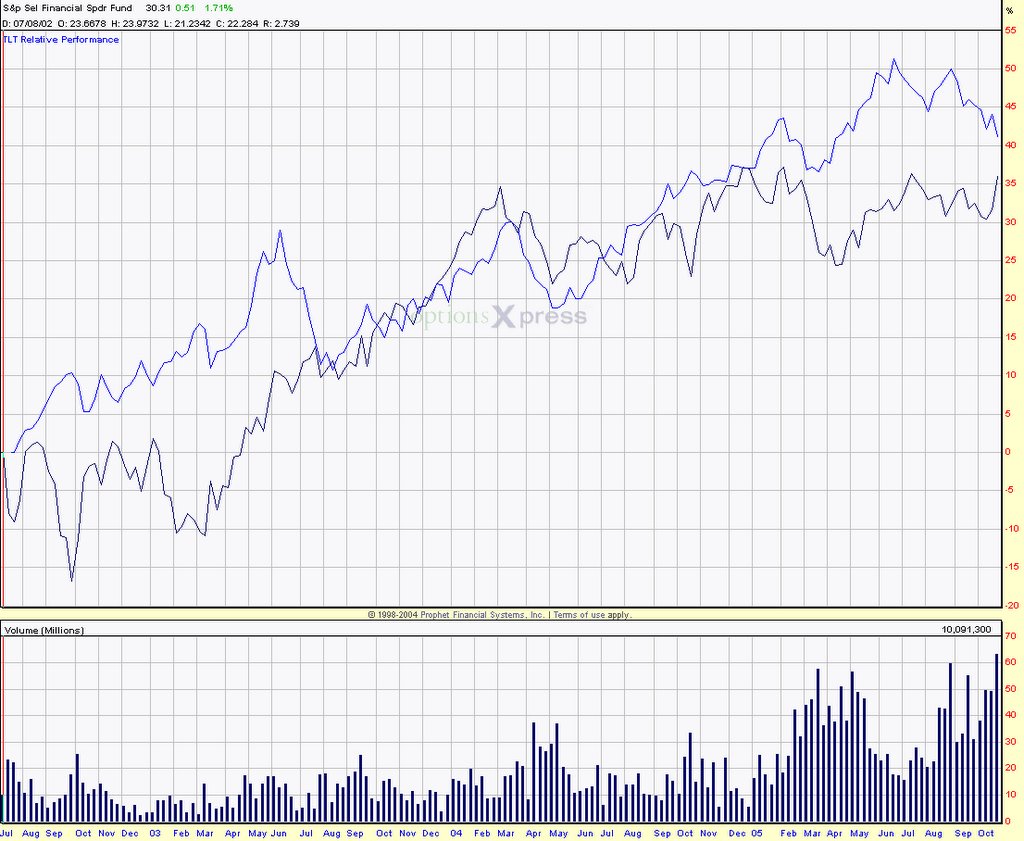 Here is the shorter term divergence between the financials and the treasuries:
 Now lets consider all of this in light of the housing bubble - first by looking at this interesting snippet from MadMoney radio show. This commentary is luckily not from Jim Cramer. Instead this is some short interview highlights from the mutual fund manager of the CGMRX real estate mutual fund. The manager makes some great points which are included below:
 Now lets examine some interesting charts comparing the housing index v. the banking index. The housing index is more volatile than the banking. Longer term chart:
 Shorter term performance:
 It is tougher to make a comparison on the housing side as the price action has been so much more volatile. Still - I believe that is exactly the point as the inflated property prices which have driven the growth of the housing sector of the market are basically the shaky collateral for the stable and steady rise of the financials. I think it is only a matter of time before the cracks in the foundation become evident.
I will leave everyone with that dark and ghoulish tale for the Halloween weekend. I hope everybody is planning some hijinks/partying from here on out. I am more than happy to put on my bull costume and join the party - if someone can just put out a convincing argument for me!!! :)
Best regards,
BG
posted by Ben Green @ 9:21 PM
![]()
![]()
0 Comments:
Post a Comment
<< Home