![[Most Recent Quotes from www.kitco.com]](http://www.kitconet.com/images/live/s_gold.gif)
![[Most Recent Quotes from www.kitco.com]](http://www.kitconet.com/images/live/s_silv.gif)

Follow up on XLF and the Yield Curve
We haven't talked much about the yield curve or the performance of the financials lately - so lets revisit this hot sector. First the yield curve..........
The yield curve continues to flatten slowly progressing towards a potential inversion sometime in the next few months. For a brief period long rates were rising just as fast as the short rates (we had 30 year treasuries up in the 4.85% yield range). Now with the Fed's continued tightening bond investors appear to be comfortable with the economy's inflation prospects and have begun buying the long bonds again. Here are the charts:

 There has been a lot of talk on the street lately that the Fed is nearing the end of its tightening cycle.....etc. and that is being used as justification for the year end rally and the "why" behind the current rally. I do not debate the strength of the current rally and think it could carry us even into the 11,500 area again. But I think the logic re: the rate hikes will prove to be flawed. I expect Greenspan to continue the tightening at least until he gets to 4.5% and Bernanke may follow through all the way to 5% on the Fed Funds. By that point I am thinking that we would finally have our inverted yield curve and with it some serious debauchery in the market. This is not eagerly anticipated by me.......I just don't believe 1) that Greenspan is going to stop hiking rates soon and 2) that our finance-based economy is going to react positively to these types of moves in interest rates.
I am also skeptical that the financial institutions which provide so much of the credit for our finance based economy are going to remain wildly profitable in an environment where 1) the spread on their lending is reduced or even goes negative, 2) the collateral values for their lending potentially come into quesiton and 3) counterparty/credit risk is reintroduced both vis a vis an overly leveraged borrower and questionable financial backing of the institutions who are guaranteeing that credit risk (re: Fannie and Freddie).
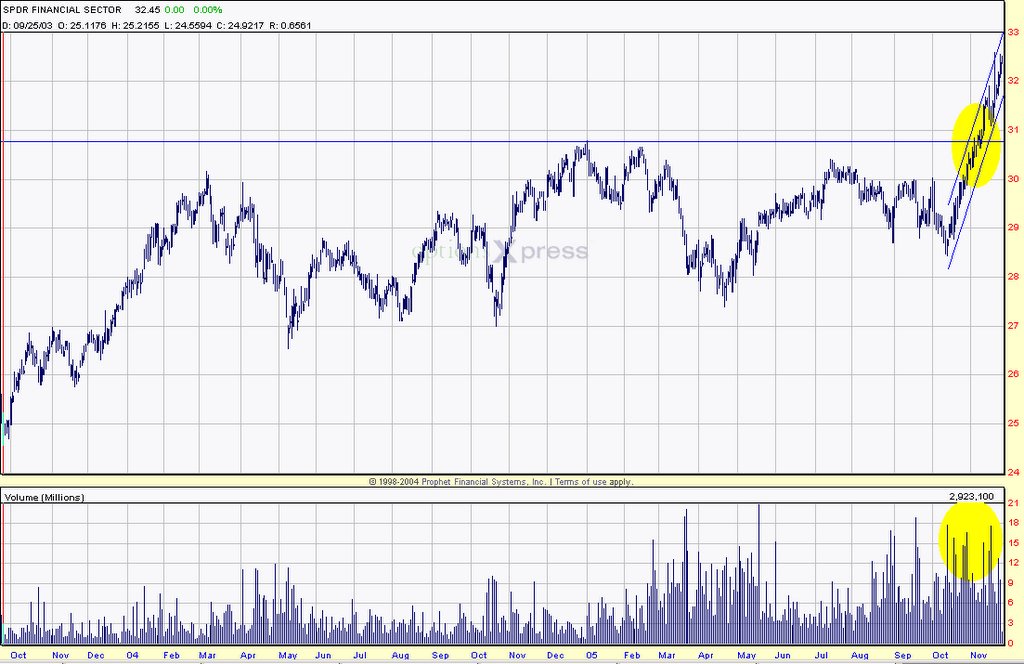
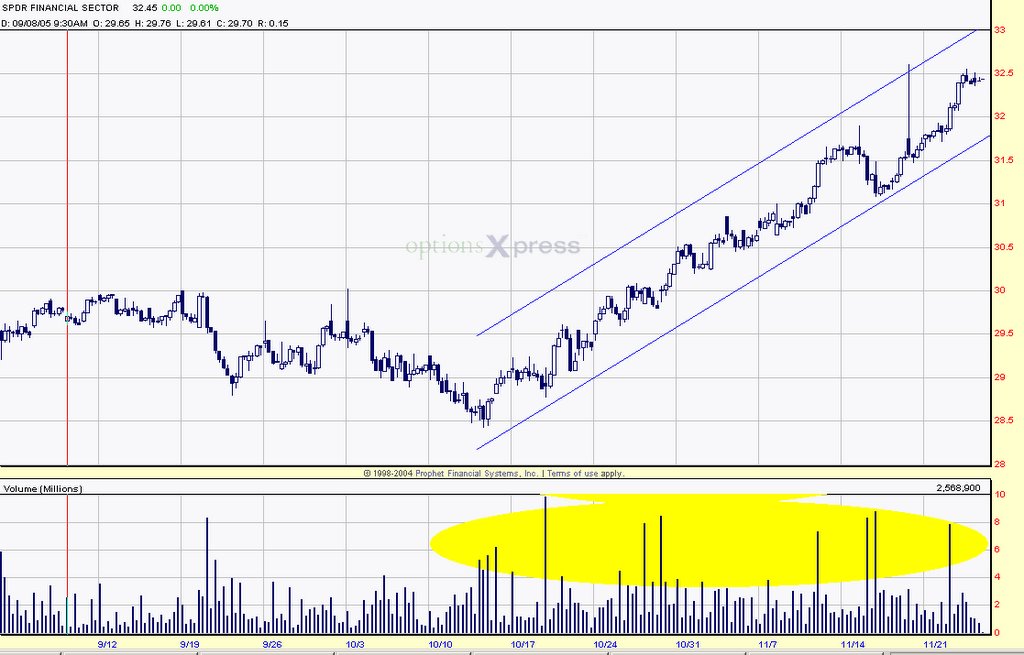
Which of course - brings us back to the financials and the XLF. Take a look at these charts:
XLF Multi-year:
XLF 60 day:
XLF 3-year:

Here is what is standing out to me from the above charts:
1) XLF and the financials are in a long-term uptrend that has yet to be broken
2) XLF broke out of a long-term trading range within the past 30 days by moving 10%+ to the upside
3) XLF is currently trading in an upward channel that appears very well defined.
4) Volume supporting the recent move is confirming.
So here is the $1 million dollar question - why is the price trending so strongly upward in the face of what I would consider challenging fundamental prospects to say the least?
The only really good rationale that I can come up with is simply that we are still in the boom phase of the cycle. I keep expecting apocalypse around the next corner - but as far as the general population and most investors feel - things are great. Their wealth is increasing through the asset inflation they are experiencing in the real estate and bond markets and inflation appears to be quite tame in the consumer goods that we love to buy.
So lets keep it at that for now and I will keep trying to fight back the urge to call a top in the XLF again and instead just watch this huge move as it unfolds.
Best regards,
BG
posted by Ben Green @ 9:40 AM
![]()
![]()
0 Comments:
Post a Comment
<< Home