Wednesday, November 30, 2005

Blogging Hiatus

I regret to inform any readers that any posts will be few and far between over the coming 3-4 weeks. I am wrapping up my final exam period right now and work has also been very challenging lately. I hope to return more relaxed and ready to analyze where the capital markets and the portfolio are at near the last week of December / Early January. Any posts in the meantime are gravy.

Ending notes:

1) NCTY is hitting new 52-week lows right now. I am just watching this one as it is at 52-week lows and may breakdown to make new lows.
2) XLF has cracked a bit in the past couple days but I think that it is probably headed higher again before the year ends.
3) Gold touched $500 and retreated. It will be interesting to see how the dollar and gold react to the expected ECB rate increase tomorrow as well as the statements made in the coming FOMC meeting.
4) I believe that we have seen the cycle peak in property and we are about to enter a major rough spot in coming 12 months. We will see very clearly how closely consumer spending is tied to home equity extraction.

Best regards,

BG

Sunday, November 27, 2005

Follow up on XLF and the Yield Curve

We haven't talked much about the yield curve or the performance of the financials lately - so lets revisit this hot sector. First the yield curve..........

The yield curve continues to flatten slowly progressing towards a potential inversion sometime in the next few months. For a brief period long rates were rising just as fast as the short rates (we had 30 year treasuries up in the 4.85% yield range). Now with the Fed's continued tightening bond investors appear to be comfortable with the economy's inflation prospects and have begun buying the long bonds again. Here are the charts:

There has been a lot of talk on the street lately that the Fed is nearing the end of its tightening cycle.....etc. and that is being used as justification for the year end rally and the "why" behind the current rally. I do not debate the strength of the current rally and think it could carry us even into the 11,500 area again. But I think the logic re: the rate hikes will prove to be flawed. I expect Greenspan to continue the tightening at least until he gets to 4.5% and Bernanke may follow through all the way to 5% on the Fed Funds. By that point I am thinking that we would finally have our inverted yield curve and with it some serious debauchery in the market. This is not eagerly anticipated by me.......I just don't believe 1) that Greenspan is going to stop hiking rates soon and 2) that our finance-based economy is going to react positively to these types of moves in interest rates.

I am also skeptical that the financial institutions which provide so much of the credit for our finance based economy are going to remain wildly profitable in an environment where 1) the spread on their lending is reduced or even goes negative, 2) the collateral values for their lending potentially come into quesiton and 3) counterparty/credit risk is reintroduced both vis a vis an overly leveraged borrower and questionable financial backing of the institutions who are guaranteeing that credit risk (re: Fannie and Freddie).

Which of course - brings us back to the financials and the XLF. Take a look at these charts:

XLF Multi-year:


XLF 60 day:


XLF 3-year:


Here is what is standing out to me from the above charts:

1) XLF and the financials are in a long-term uptrend that has yet to be broken
2) XLF broke out of a long-term trading range within the past 30 days by moving 10%+ to the upside
3) XLF is currently trading in an upward channel that appears very well defined.
4) Volume supporting the recent move is confirming.

So here is the $1 million dollar question - why is the price trending so strongly upward in the face of what I would consider challenging fundamental prospects to say the least?

The only really good rationale that I can come up with is simply that we are still in the boom phase of the cycle. I keep expecting apocalypse around the next corner - but as far as the general population and most investors feel - things are great. Their wealth is increasing through the asset inflation they are experiencing in the real estate and bond markets and inflation appears to be quite tame in the consumer goods that we love to buy.

So lets keep it at that for now and I will keep trying to fight back the urge to call a top in the XLF again and instead just watch this huge move as it unfolds.

Best regards,

BG

Thursday, November 24, 2005

So stuffed.......

Wow what a great Thanksgiving dinner today! The whole family was present including the extended fam - and there was plenty of pecan pie - my favorite. I also took a break today from work and studying and had the chance to watch the new Harry Potter move (thumbs up) and read a few interesting economics/finance related articles that I just hadn't had time to look at yet.

I read a few articles from Marc Faber which were quite enlightening / stimulating. They gave a different view/analysis of the basically the entire US (and world for that matter) financial system. I guess the most facinating idea was the way that we consider and measure inflation in the United States from a values perspectiver. The government places a lot of emphasis on consumption related inflation, but tend to ignore asset inflation (re: bonds, stocks, and real estate). Most Americans consider asset inflation as a "good thing," - e.g. - so and so got rich in the stock market or in "real estate." I guess the basic idea being that so long as our asset prices are appreciating we are all experiencing greater "wealth" and can use that asset based wealth to fund future purchases and consumption (re: STUFF) which thanks to the low consumption type inflation over the past 10 years is still CHEAP.

The articles examined the structural assumptions that this type of system is based on - principally cheap financing / low real interest rates. Taking these thoughts a step further I believe when we evaluate the performance of our Central Bank and its chairmen we actually heap a ton of praise on these "managers" of our monetary system precisely because they have enabled a system (through accomodative monetary policy over a long period of time) that encourages the inflation of and demand for financial assets.

This thought is also particularly striking to me re: the performance of both the stock market and the real estate market over the past 25 years. We had the stock market "bubble" and now the real estate "bubble," but overall the population considers both of these developments as quite positive. The stock market bubble was considered largely a testament to our entrepreneurship and business success, while the real estate market has a variety of great and tangible micro type factors that are considered (e.g. scarcity of land, growing population, beauty (re: coastal, etc.), utility). Much emphasis is placed on the observable facts - i.e. that property prices are up around 200% over the past five years in Coastal California and many other areas of the country. But little discussion at least in the mainstream press re: the probable causes and genesis of these developments (most notably an intense interest rate cutting strategy from the Central Bank taking the fed funds rate from 6% to 1% between 2001 and 2003.)

Before this turns into a real estate based rant, I want to bring this to a close and just restate the basic idea - that is - maybe we should be just as concerned about asset price inflation in our economy as we are about consumer price inflation. That is - if we as country begin to consider and respect as the best examples of wealth creation - 1) real estate speculation and 2) continued increases in stock and bond prices. This would seem to be quite a shift in sentiment as our country traditionally considered the creation of real wealth through the production and development of new technologies and goods, or perhaps a more efficient way to provide services as the most impressive type of entrepreneurship - not the ability to leverage yourself 10-1 in 2003 and then resell the asset of your choice (real estate, stock, or bonds) for 1000%+ profits.

Even if you consider the basic premise of this blog a huge amount of emphasis is placed on speculation instead of investment. By my own design of course - but these thoughts really provoked me and I am excited to share them with all readers. I do not plan to change the emphasis of the blog but I do find myself asking - am I just another cog in the wheel speculating based on historical trends that are unsustainable? - or am I hopefully beginning to catch glimpses of the broader framework that defines the financial markets and may provide a useful fundamentals based design in the years ahead? As I said - "hopefully' the latter - but more likely the former!

Best Regards and Happy Thanksgiving!

-BG

Wednesday, November 23, 2005

Sandisk Followup

Sandisk is gettin another nice bounce today falling the 5%+ pop yesterday. Maybe this is just short correction - I don't know - but it was nice to see this commentary on the flip side of the Oppenheimer Analyst from Merrill Lynch (reuters is the news source):

"A new venture between Intel Corp. and Micron Technology Inc.
to make memory chips for consumer devices will
not hurt rivals because demand will be stronger than
expected, Merrill Lynch said on Tuesday.
Merrill also upgraded Micron to "buy" the day after the
company announced the $2.4 billion venture to make
memory chips used in gadgets like digital cameras and
music players. By 2007, the venture would produce up to 10 percent of the world's supply of the memory chips -- known as NAND flash -- but demand for them would keep pace with or exceed supply, due in part to their anticipated use in laptop computers, Merrill said.
"Our new demand analysis clearly suggests that this will not lead to oversupply in NAND," Merrill analysts said in a research note. "Rather, NAND could easily be in shortage if new demand from new applications such as notebook PCs soaks up all capacity increases."
Micron shares rose 36 cents, or 2.5 percent, to $14.56 in afternoon Nasdaq trading. Intel shares were up 76 cents, or 3 percent, at $26.01.
News of the deal sent shares of Asian tumbling on concerns that increased competition could trigger a collapse of the fast-growing NAND flash market.
Shares of SanDisk Corp. , a U.S.-based memory maker whose shares fell 16 percent on Monday, rebounded somewhat on Tuesday, rising $2.55, or 5.4 percent, to $49.39.
Merrill said the Intel-Micron deal should not hurt other memory makers. It raised its forecast for NAND sales to $16 billion from $13 billion for 2006 and to $18 billion from $15 billion for 2007. One sign of strong demand also came on Monday when Apple Computer Inc. said it would prepay $1.25 billion to secure a long-term supply of memory used in its iPod music players. It struck contracts with five memory companies, including Intel and Micron."

I think what the article is alluding to is the possibility that Apple might make a new flash based laptop / portable computer that takes computing to a new degree of both beauty and elegance (think really really thin.) I don't know if Flash provides enough performance for this currently - but maybe it you install enough memory into the system - (re: 1-2Gig or more) the performance advantage will help to offset the effects of the slower hard drive access if instead Flash was used as the storage source (with Flash sizes quickly approaching 5-10 gigs - you can imagine the possibilities).

Best Regards,

BG

Monday, November 21, 2005

Quick and dirty

Here is the basic breakdown on today - I am just isolating to one stock/sector. Sandisk got absolutely trashed today down about 15% on HUGE volume. My first suspicion is that the market is overreacting here. Still I think the stock can retrace maybe as far down as 35 or lower on this news. This has been exactly the type of news re: increasing competition and margins pressure that has been killing the stock over the past few years. I don't think the analysis re: Micron and Intel entering mass NAND flash production gives enough credit to Sandisk's intellectual property portfolio and the substantial royalties they have already been extracting from the semi-industry already - re: close to $60M per quarter.

The following is my recent post to bill cara's blog. He had several great posts today on Sandisk and I don't want - nor do I have time to duplicate any more. So here is the link again to his website: www.billcara.com - and my specific comment - highlighting what I think the principal issue is:

"Great post again. Most important point for me in your post was: "Could this be a Coke/Pepsi war in the making – the one where brokers can take the stock to the moon?."

If you have tracked Sandisk CEO's comments over past several years this has been exactly his point. He doesn't care if Sandisk's margins fall on the older products - he is just trying to grow an $X billion dollar yearly market into a $XXX billion dollar market. Then Sandisk can license its technology and enforce its patents against each producer while remaining a marginal producer itself. Of course the reason that it may maintain a multiple of 20-30 is that royalty based revenue.

Now with the promise of BOTH mobile phone market and Ipod market the flash memory sector outlook has been quite bullish. The following quote is what I saw replayed over and over again earlier today: "This venture is probably going to be a substantial threat to SanDisk," said Oppenheimer & Co. analyst Vijay Rakesh, who recently initiated coverage on the stock with a "Neutral" rating. "Intel and Micron don't have to pay royalties to SanDisk -- and right now SanDisk makes about 15 percent of its revenues, or 40 percent of its operating profit, from royalties. Plus Intel and Micron can increase memory supply and put pricing pressure on SanDisk."

The last sentence regarding Intel and Micron - "not having to pay royalties" is one reason I think the stock was down 15% today instead of 5%. Bill's article alluded to this as did TheStreet.com article. For me though this is exactly the crux of the issue - as Intel and Micron just validate what a hot market this really is - now can Sandisk retain and enforce its IP portfolio? So far so good.....

Its getting close to $60M a quarter royalty revenue. This is up near 50% from last year. If market continues to grow and IP portfolio is honored we could be talking $100M a quarter not too far out - then we can make the Qualcomm type comparisons for a minute at least and see what kind of multiple gets awarded. Then we see $100-200 stock price.

Question is in the meantime - who is right regarding the IP portfolio. And more importantly -is the Oppenheimer analyst - a) on top of things, b) a moron, c) rigging the game to bring the stock in to pick up shares, or d) misquoted. I have no clue and I have not read his research report so no further analysis.

Best regards and I apologize for any repetition.

-BG"

Have a great night!
-Ben

Sunday, November 20, 2005

More factors - confusion or enlightment?

Every week I consider a variety of sources when I am thinking about speculating or even investing in a particular stock, bond, option trade, etc. I have posted some of my favorite sources in the links section of the page. Most of my trades have some origin in the fundamentals - the idea could be industry-specific - re: housing or flash memory - or a broader macro focus - re: rising interest rates / narrowing interest spreads - re: financials. However, I have found myself depending more and more on charts in making a decision. I look more often lately to trend lines, support and resistance, volume, and other rudimentary indicators. I am an elementary chartist so I don't have any expectation of success based on my technical analysis skills. Instead, it is more of an observation about my development - not sure if it is good or bad. One of my goals in finishing up this year and in the months/years going forward is to combine an approach to investing / speculating that is multi-tiered. The following in no particular order of importance are what I consider in aggregate to be necessary requirements/considerations for my investment methodology (I don't know enough yet to rank them):

1) Macro considerations - what are interest rates, currency rates, GDP, inflation, etc. telling us about the market. Where exactly are we in the business cycle? (and yes - I do believe that business cycles EXIST.) And how does my investment choice match up to this broader outlook - did it have its genesis from macro considerations, and if not - if it is instead more of a micro or value play, etc. - could it be negatively impacted by known macroeconomic considerations (can't consider catastrophic low probability events)

2) Technical considerations - what does the chart tell me about where this stock has been and where it is headed? What is the long term trend? Is volume confirming? Has the stock recently pierced some important support or resistance line? Is it battleground stock? Is the stock liquid?

3) Fundamentals - what is the outlook for the specific industry? Where does the company rank in it industry re: traditional metrics - earnings growth, debt levels, profit margins? Does the company have any type of economic/competitive advantage - re: royalty revenue or really high gross margins or quasi-monoply position, etc.?

4) Event risk - am I buying this security contingent on some type of event - re: earnings, new product release, FDA approval, etc. - and if my expectation does not develop what is the downside risk in the stock? Is this a 1 point down and 10 points up opportunity (re: NCTY) or is this a 1 point up and 10 points down potential?

5) Bull/bear - am I fully capable of arguing both sides of the trade? If I am unable to understand both sides - then I may be surprised. Being surprised in financial markets is seldom a "good thing."

I am currently thinking that the best plays are those that have a solid macroeconomic underpinning (re: several tail winds) are not in a late stage climax run technically and have solid and hopefully improving fundamentals.

I have done a lot of heavily event based trades this year with mixed results. My goal going forward is to make longer term trend based trades in the sectors that I like and try less to call short term market movements - unless I figure that I have an undeniable advantage re: analysis (this will happen seldom to never.) I have a few different ideas on how to implement this approach. A good start would be to apply the above framework for considering each trade. Another good step would be to keep lists of sectors that I consider "troubled" or "cloudy future" fundamentally and see how long they can technically battle the inevitable - XLF definitely fits here as well as TLT :). I could also track the sectors that I think have a bright future and where exactly they are in the cycle. Could also be used as a proving ground for future selections.

Best regards,

BG

Best regards,

BG

Compound Annual Return


Sorry

I apologize for the forthcoming mass posts - but I think that the easiest way - logistically for me to add both the compound return links on the left and also the trade history sections is to just make two posts today that I then go back and edit over time.

Regards,

BG

Trailing Trade History

Analysis Data For 1/1/1999 - 1/1/2006
Trade Date
Action Symbol/Desc. Qty Price Comm. Net Amount Gain/Loss for symbol
ALLIED WASTE INDS INC
07/27/2005OSTC.AWHU - AW AUG 7.5 Call20$0.70$30.00$1,369.94
07/25/2005OBTO.AWHU - AW AUG 7.5 Call20$0.65$30.00($1,330.00)39.94
Total Realized Gain/Loss for AW$39.94
FRONTLINE LTD
08/31/2005SSellFRO - FRONTLINE LTD41$46.80$14.95$1,903.77
08/29/2005SBuyFRO - FRONTLINE LTD41$43.76$14.95($1,809.11)94.66
Total Realized Gain/Loss for FRO$94.66
GG
10/10/2005OSTC.GGAW - GG JAN 2006 17.5 Call5$3.30$12.95$1,636.98
09/20/2005OBTO.GGAW - GG JAN 2006 17.5 Call5$3.20$14.95($1,614.95)22.03
Total Realized Gain/Loss for GG$22.03
THE 9 LIMITED
11/10/2005SSellNCTY - THE 9 LIMITED400$16.9066667$9.95$6,753.77
11/10/2005SBuyNCTY - THE 9 LIMITED400$17.79$0.00($7,116.00)
10/10/2005SSellNCTY - THE 9 LIMITED100$18.51$9.95$1,840.97
10/03/2005SBuyNCTY - THE 9 LIMITED100$17.48$14.95($1,762.95)-284.21
Total Realized Gain/Loss for NCTY($284.21)
NEWMONT MINING CORP
08/29/2005SSellNEM - NEWMONT MINING CORP100$39.56$14.95$3,940.88
06/13/2005SBuyNEM - NEWMONT MINING CORP100$42.10$0.00($4,210.00)-269.12
12/30/2005OSTC.NEMAJ - NEM JAN 2006 50 Call4$4.00$12.95$1,587.00
12/29/2005OSTC.NEMAJ - NEM JAN 2006 50 Call3$4.10$12.95$1,217.01
12/28/2005OSTC.NEMAJ - NEM JAN 2006 50 Call3$3.50$12.95$1,037.02
09/23/2005OBTO.NEMAJ - NEM JAN 2006 50 Call10$1.50$15.00($1,515.00)2,326.03
09/14/2005OSTC.NEMIU - NEM SEP 37.5 Call5$5.90$14.95$2,934.93
09/09/2005OSTC.NEMIU - NEM SEP 37.5 Call5$4.50$14.95$2,234.96
08/29/2005OBTO.NEMIU - NEM SEP 37.5 Call10$2.20$15.00($2,215.00)2,954.89
Total Realized Gain/Loss for NEM$5,011.80
PHM
08/17/2005OSTC.PHMTS - PHM AUG 95 Put2$8.60$14.95$1,704.98
08/05/2005OBTO.PHMTS - PHM AUG 95 Put2$6.50$14.95($1,314.95)390.03
10/06/2005OSTC.PHMVP - PHM OCT 47.5 Put1$9.10$12.95$897.01
10/05/2005OSTC.PHMVP - PHM OCT 47.5 Put2$8.40$12.95$1,666.98
09/30/2005OBTO.PHMVP - PHM OCT 47.5 Put3$4.20$14.95($1,274.95)1,289.04
Total Realized Gain/Loss for PHM$1,679.07
RGLD
10/23/2005OSTC.MJQJE - RGLD OCT 25 Call50$0.00$0.00$0.00
10/13/2005OBTO.MJQJE - RGLD OCT 25 Call10$0.15$12.50($162.50)
10/13/2005OBTO.MJQJE - RGLD OCT 25 Call15$0.15$3.80($228.80)
10/12/2005OBTO.MJQJE - RGLD OCT 25 Call25$0.25$31.25($656.25)-1,047.55
Total Realized Gain/Loss for RGLD($1,047.55)
RIMM
10/17/2004OSTC.RUPVM - RIMM OCT 65 Put1$0.00$0.00$0.00
09/17/2004OBTO.RUPVM - RIMM OCT 65 Put1$1.70$14.95($184.95)-184.95
Total Realized Gain/Loss for RIMM($184.95)
SHIP FINANCE INTERNATIONAL LTD
07/15/2005SSellSFL - SHIP FINANCE INTERNATIONAL LTD36$19.85$14.95$699.62
06/13/2005SBuySFL - SHIP FINANCE INTERNATION36$0.01$0.00($0.36)699.26
Total Realized Gain/Loss for SFL$699.26
SNDK
07/22/2005OSTC.SWQHE - SNDK AUG 25 Call2$6.70$14.95$1,324.99
07/21/2005OBTO.SWQHE - SNDK AUG 25 Call2$3.30$14.95($674.95)650.04
Total Realized Gain/Loss for SNDK$650.04
WB
10/10/2005OSTC.WBMJ - WB JAN 2006 50 Put4$3.60$12.95$1,426.99
09/30/2005OBTO.WBMJ - WB JAN 2006 50 Put4$3.40$14.95($1,374.95)52.04
Total Realized Gain/Loss for WB$52.04
XLF
10/21/2005OSTC.XLFVD - XLF OCT 30 Put20$0.55$25.00$1,074.95
10/10/2005OBTO.XLFVD - XLF OCT 30 Put20$1.00$25.00($2,025.00)-950.05
11/20/2005OSTC.XLFWD - XLF NOV 30 Put20$0.00$0.00$0.00
10/21/2005OBTO.XLFWD - XLF NOV 30 Put20$0.80$10.05($1,610.05)($1,610.05)
Total Realized Gain/Loss for XLF($2,560.10)
Total Realized Gain/Loss$4,172.03

Real-time portfolio updates are online

I finished adding the real-time portfolio link. I was unable to figure out a better system than just posting it to yahoo - so I set up a new yahoouserId - as "soulekblog" with password of "blogspot" - by logging in at the link on the left you can see all of the positions.

I am very tempted to add more to my gold position right now as the gold price has been moving so strongly upward even in the face of a stronger US dollar. Gold has been appreciating against all currencies over the past week. To some extent this should alleviate my concerns about a stronger USD due to higher interest rates in the US relative to other countries. In fact - we are seeing the stronger USD and still higher gold prices - but gold in other currencies is appreciating even faster. With the pending European Central Bank rate hike expected sometime soon - we might finally see a pause in the dollars ascent and gold could finally make its break through $500.

Fingers crossed.

Regards,

BG

Saturday, November 19, 2005

XLF Trade Expires Worthless

The last of the XLF Put options expired worthless yesterday. I would put these two XLF "short" positions as my worst calls of the year undoubtedly. I still feel that I will be vindicated by next June with the XLF trading in the low 20s - but needless to say - it was suicidal to restart the XLF short after I lost so much money on the first one.

Although I am even more bearish now on the financials than ever - I think it is stupid to underestimate the strength - and at this point - easier to just watch and see - "how high can it go?"

Entry and Exit Chart:


Profit and Loss Chart:

I don't have the description here because the trade will not be settled until sometime early next week. I can say with 100% surety though that I LOST $1610.05 entirely on this one - as the options ended out of the money and worthless.

I am still looking for a good site to play the real time portfolio in. I may end up choosing Yahoo - but then unfortunately you have to use login/pass each time.

Gold is looking very strong and I want to buy more now - however I am forcing myself to have discipline in the portfolio - as I already have a sizeable leveraged position that will make good money if Gold does in fact go into the $500 range as it is looking.

Here is the portfolio snapshot - disregard the XLF position as it is no longer active:


At one point last week the portfolio was as low as $7200. This occurred before the gold call options took off. I am tempted to buy more of the Newmont call options - even here as if gold does make a move into the $550 range the stock should be around $60 and the calls worth a minimum of $800-900 each. This is a big spec bet though and I think I would rather just stay in cash - as my current position allows me plenty of upside. It may be nicer to allow some more time horizon as well - we will see.

Best Regards,

BG

Thursday, November 17, 2005

Just a few minor things :)

I have had a few interesting reader mails in the past few days. One important comment was regarding NCTY (The9). A reader who follows the sector closely pointed out an inaccuracy in my summary. I had posted that The9 partnered with Softworld in Taiwan for 30% interest in the operations there. In fact this appears to be inaccurate as The9 has only publicly stated that they are partners in another venture - "outside of Mainland China." This could be anywhere in Southeast Asia. I expect the actual location to be disclosed in the 10-Q report and will give the info when it is released.

Next reader mail. Readers seem to like watching my performance in realtime as it gives them the ability to watch me lose money - 24/7. :) I have decided to form a new Yahoo portfolio that I will make public. This will mirror the actual portfolio in my trading account. This should not be hard to achieve now because I have so few positions. However, if I do begin trading more actively as I was in September and October of this year it may become difficult to update routinely. Basic point - I am looking for any software or website that people are aware of that will allow my portfolio print to automatically sync with my brokerage - OptionsXpress. If anyone is aware of anything like that - please let me know.

So in the interests of transparency - I will begin posting both the portfolio real-time link and also an archived list of all transactions including commissions from the inception of the account (while at least since inception of OptionsXpress account in 2004 - previously I was with Ameritrade back in 99/2000/2001/2002/2003 - trading activity was basically non-existent as i lost all my money in a telecom that went bankrupt)- so all readers can see where I have made good calls and bad calls this year without going through each post. There will also be a link showing the contributions to the account and the compound annual rate of return since the account inception. Look for the new segregated links under the sub-heading "real-time updates," on the left side. Hopefully can get it up there by tonight - but if not look for it this weekend.

Final note - I got engaged tonight! It is a happy feeling - but it makes me feel old too. :)

Best regards,

BG

Goldmember

Its amazing how fast gold has bounced back - but it is hitting new highs this morning. $500 is looking more and more likely. Here is the price chart over the past 2 weeks:
One of the most amazing things about the recent strength - is Gold is not appreciating vis a vis one currency and losing strength against the other. The dollar has been very strong relative to the other currencies over past few days - but still losing ground to gold at the same pace as the other currencies. Case in point - Gold is currently trading around 413 Euros. This is an all-time high in Euros and if you were to apply the January 2005 exchange rate when dollar was much weaker - you can get 413 Euros X 1.35 exchange = $557 gold price. That may be too bullish here in the near-term - but I am keeping an eye on the amazing strength right now. Here is the chart of all currencies, etc.:


Regards,

BG

Monday, November 14, 2005

M3 Discontinued

On an interesting note - the Federal Reserve has decided to stop publishing the M3 statistic. M3 is one of the broader definitions of "money" and collectively with the other forms of money as defined by the Federal Reserve (re: M0, M1, M2, and M3) - they compose the money supply. As a sustained increase in the money supply is typically associated with inflation - these measures are often closely watched. I am somewhat skeptical about the announcement - as it makes no sense to me - why as a quasi-governmental entity as this point in the game if you want to retain your independent reptuation - you would make a move towards being less transparent. Ironically M3 has been one of the leading inflation indicators over the past 5 years as it has grown at around 8% v. real GDP of around 4%. I have yet to hear a good argument on why they would want to stop publishing it when you know for a fact that they are still doing the research and looking at the numbers themselves - other than to conceal information / "protect" the American public from economic statistics that like many other indicators of our economy are quite shaky.

Official announcement:

"Discontinuance of M3

On March 23, 2006, the Board of Governors of the Federal Reserve System will cease publication of the M3 monetary aggregate. The Board will also cease publishing the following components: large-denomination time deposits, repurchase agreements (RPs), and Eurodollars. The Board will continue to publish institutional money market mutual funds as a memorandum item in this release.

Measures of large-denomination time deposits will continue to be published by the Board in the Flow of Funds Accounts (Z.1 release) on a quarterly basis and in the H.8 release on a weekly basis (for commercial banks)."

Portfolio note: Not much happening. I want to reshort XLF bad - but I fear losing more money so I am going to watch it instead. It is undeniably one of the hottest sectors in the market right now, and I think we may get an indication of just how much higher it is going by continuing to watch the developments with the Fed, treasury rates, and also the CPI/PPI releases this week.

Broad market note: My expectations have changed drastically regarding the winter rally. I am currently seeing it as the sure thing. Wallstreet is in full time pump mode right now and the crucial sectors are all hot re: tech, banking, and retail. I think that the falloff in oil is also helping to fuel the rally. Most investors appear to be ignoring the rising interest rates and fed tightening. I am basically sitting this one out as my growth stock idea did not pan out and I don't have the conviction to short again here - when the market is this strong. If any one has any individual stock suggestions or inquiries re: companies they would like to see analyzed - please e-mail or post the request in comments and maybe we will take a look. Otherwise I am gong to probably continue to just keep tracking the indicators which I consider significant.

Best regards,

BG

Saturday, November 12, 2005

Reader Comments re: NCTY

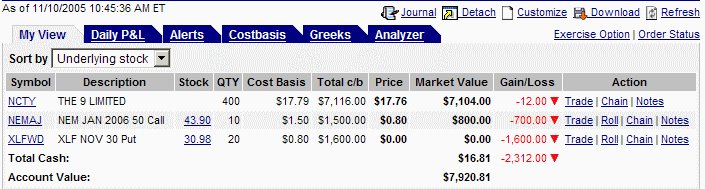
Response to the decline in NCTY has been interesting. Some have been encouraging, others have renamed me "Bad Luck Ben," other readers are value hounds and see the decline as a great buying point. The following analysis is tilted mainly to the value hounds in order to try to make the most balanced comments possible. This commentary will have three segments: 1) technical, 2) fundamental, and 3) predictive. So without further ado .......
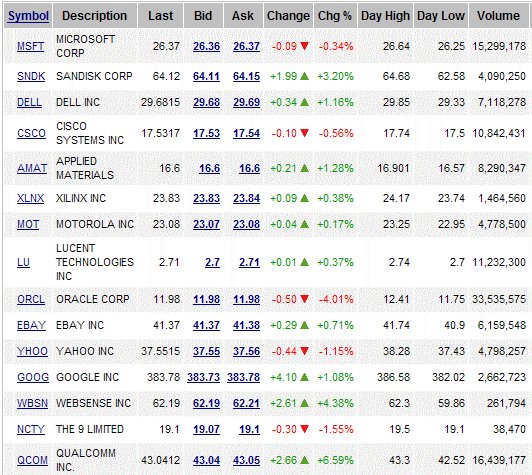
The Charts:

Charting software is backup. Here are the charts:

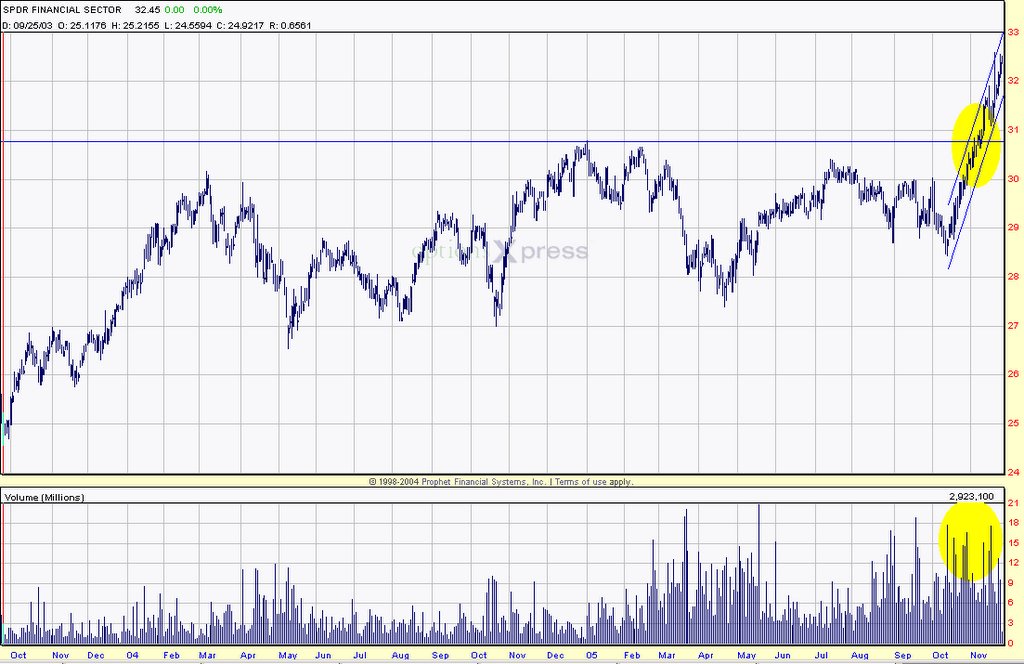
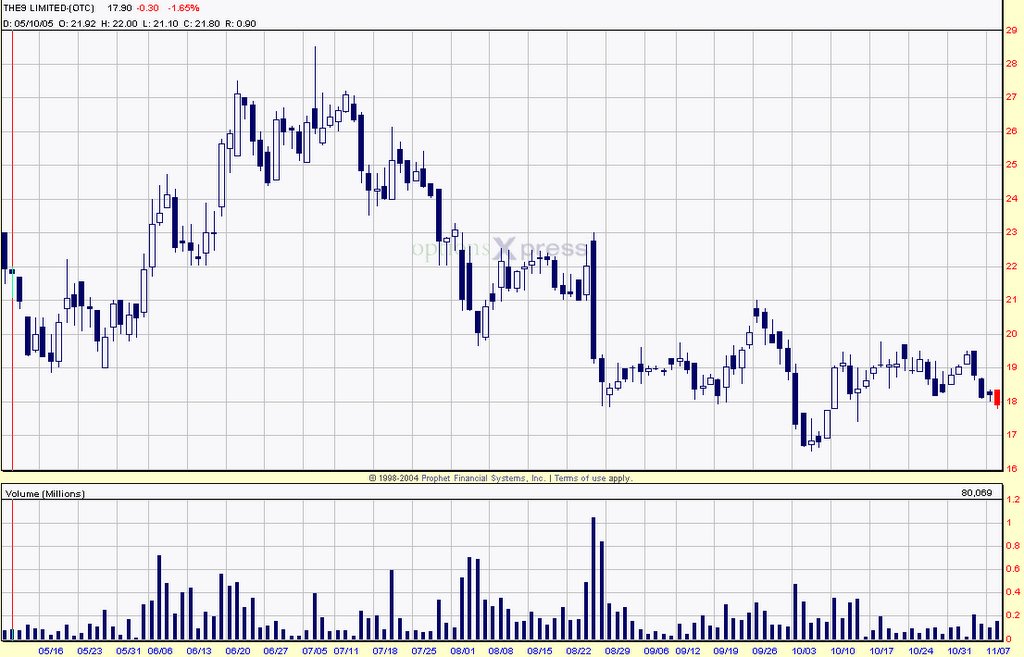
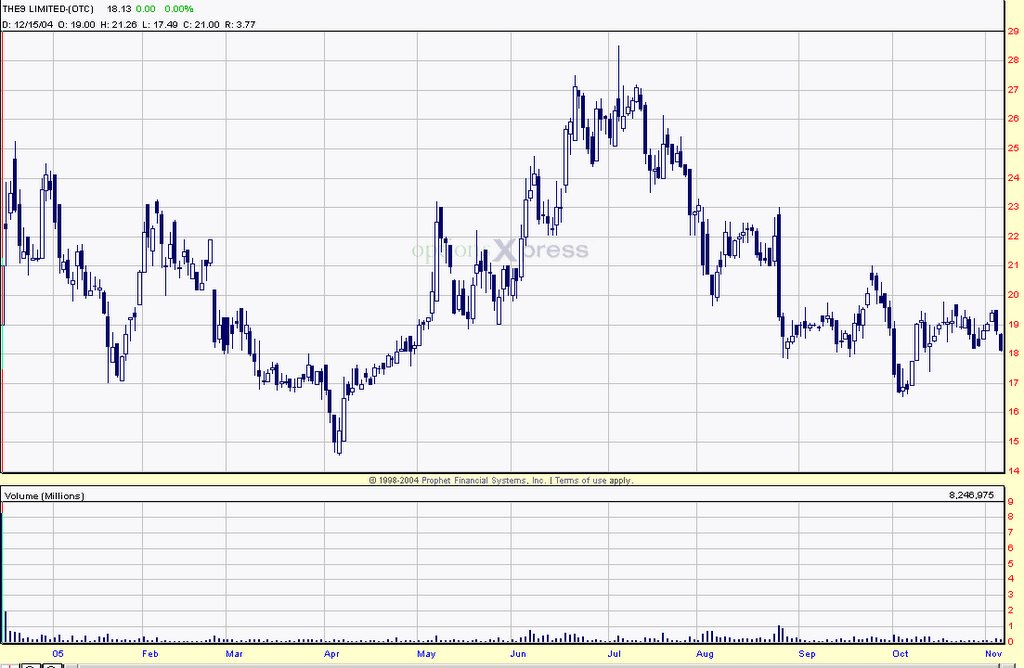
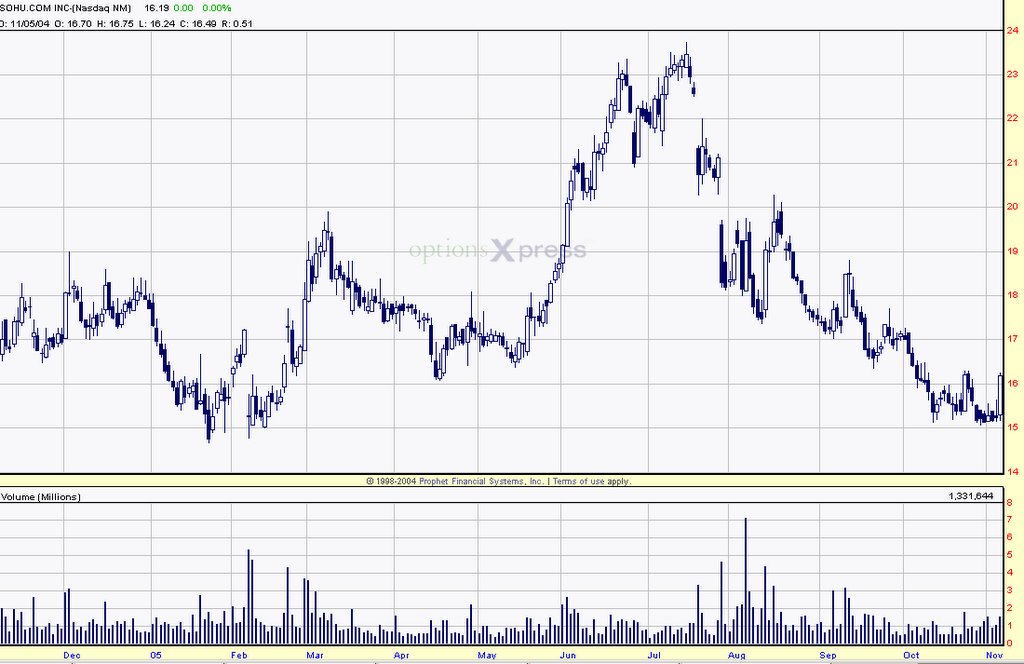
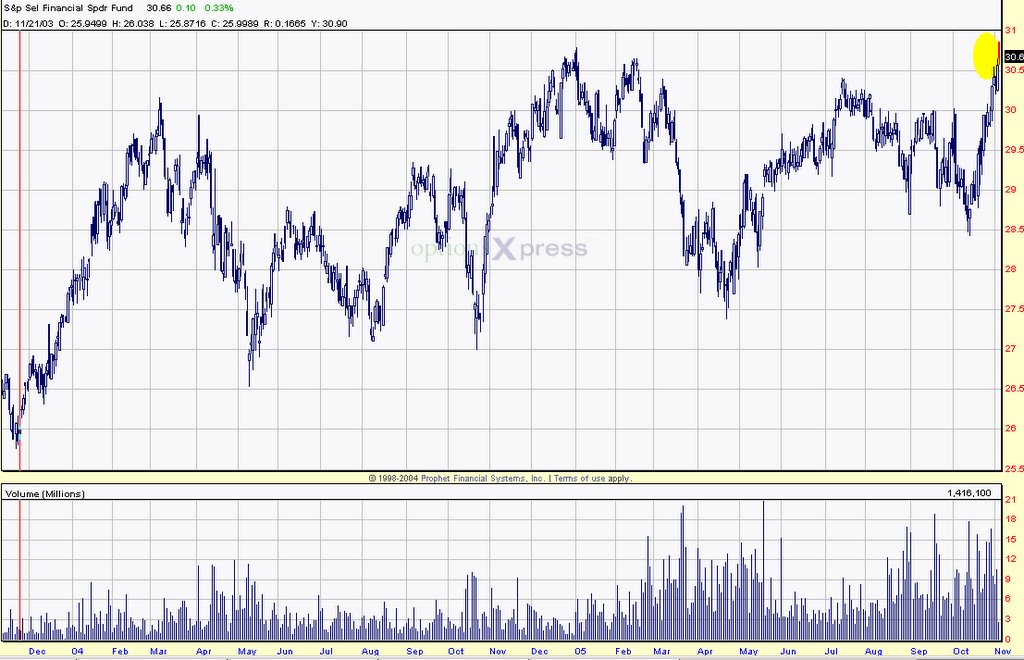
52-week chart with comments:
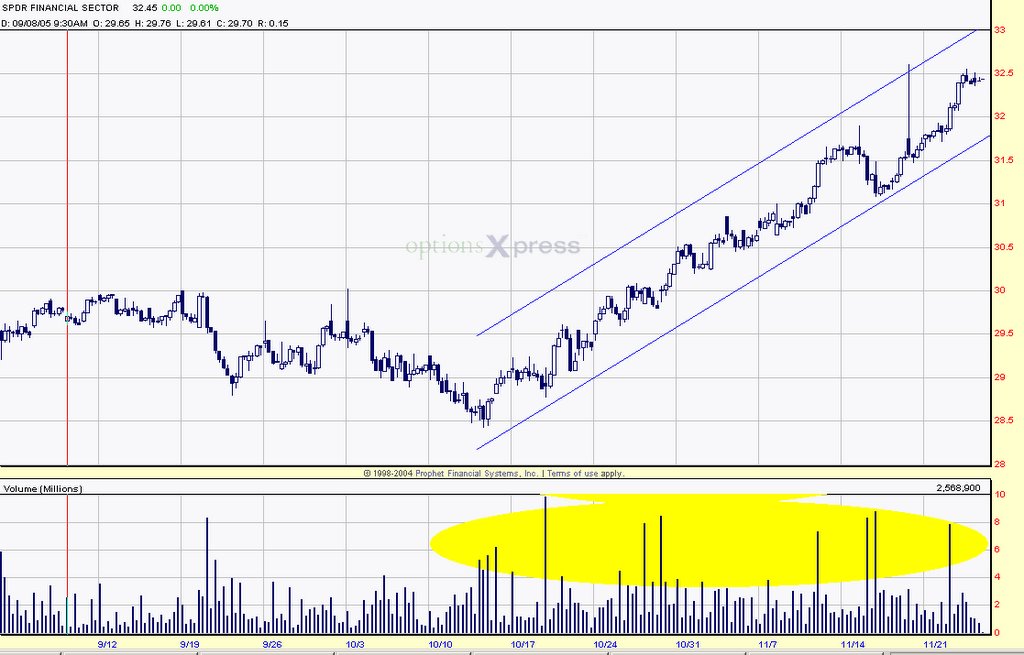
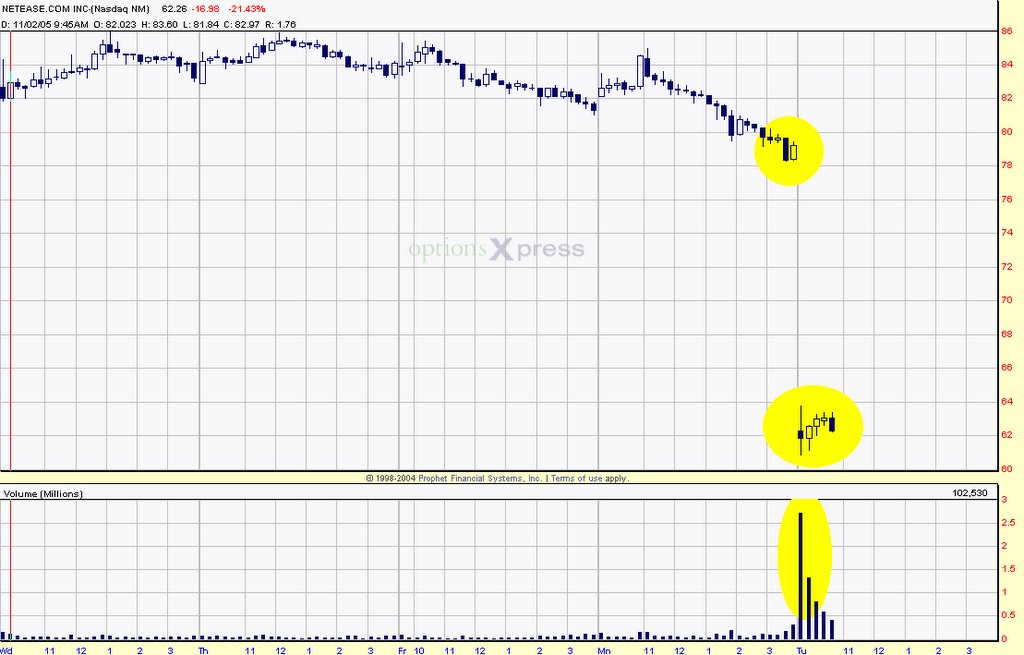
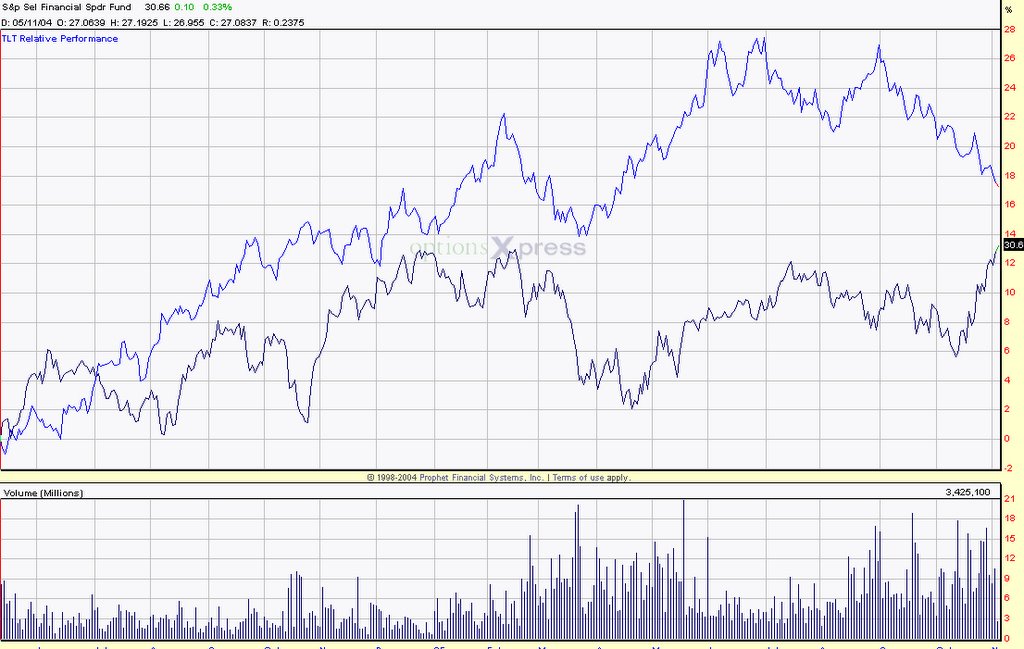
10-day Chart:


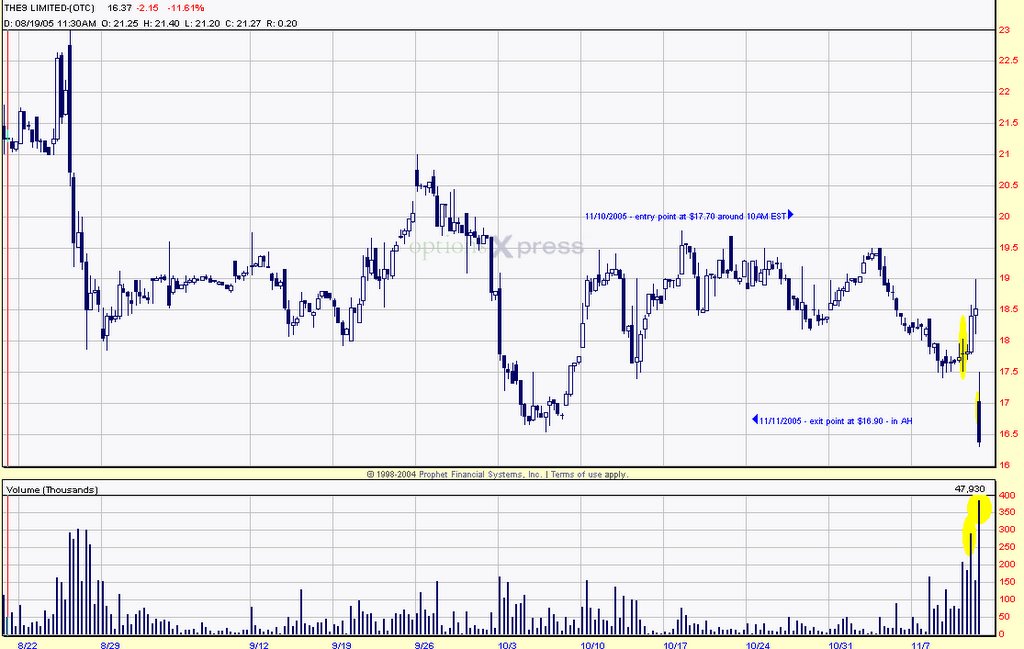
Basically - stock sold had a very high trading volume relative to its average on both Thursday and Friday. Friday had a gap down of 10%+ on notable volume. In this context and due to the low float - I think that it is quite probable that it will retest the historic lows of $14.55 sometime in the next few months. Absent a major upgrade by multiple investment houses in the next few weeks (highly unlikely), I think that downgrades are more probable - I see no rush to get into the stock at these prices. Stock may bounce back into 17s in the short term but I expect it to continue the downtrend over the next few months.
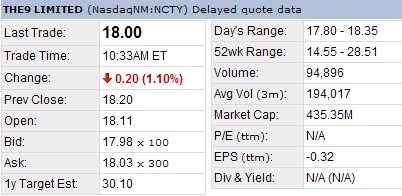
The Fundamentals:

Although the earnings were not horrible, they were much below expectations of many of the optimists - including myself. The company had EPS of $0.19 and Revenues around $23 million. Here are a few comments - I have divided into pros and cons.

PROS:

1) Company Strategy: The CEO comes off as downright arrogant, but I like the fact that he is making efforts to partner with different companies throughout Southeast Asia. He just partnered with Softworld in Taiwan to release WOW there. By gaining a presence in multiple markets the company has the opportunity to diversify its customer base somewhat and maybe operate in some markets that are less cutthroat than Mainland China is right now. They also may gain more bargaining power when it comes to negotiating new games contracts due to the multiple markets.

I like the company's strategy to license proven winners when it comes to games as well. I believe that although developing games in house could boost margins - that is a huge capital expense right now and gamers are fickle creatures who will often focus on just one or two of the best games. So why spend millions to develop your own which may or may not be successful?

NEUTRAL:

1) Product line: Most analysts consider the fact that The9 only has ONE GAME (re: World of Warcraft) as a major negative and a HIGH RISK. I think that this is a fair point. I choose to take the other side of it though and will make a stand on this issue as I consider all Blizzard games (WOW as no exception) to be a cut above everything else out there. They are all highly addicting and they seem to no ZERO cultural barriers as they are popular throughout the world.

IMPORTANT NOTE: All that The9 effectively owns is a 4-year license to operate World of Wacraft in China. They do not have anything else significant in development and they are counting on the success of Warcraft to finance them so that they contract with other big game developers in the future (re: Blizzard again probably) to port games over to the Asian market.

They have also paid serious money to get this license and they need Warcraft to be a much bigger hit to make it worthwhile -re: $200 M in revenues a year will work it. But current trend re: $100M is going to crunch them. IMHO

CONS:

1) Transparency:

I also disliked the fact that they are emphasizing different measures like EBITDA and NON-GAAP acounting measures in addition to the typical GAAP measures which is all they should be reporting. I also dislike that they are reporting most of the results in RMB (Remnibi - the Chinese Currency) instead of Dollars ONLY with RMB as footnotes.

I also think that The9 should post weekly totals of both ACU and PCU on their website as public record. ACU = average concurrent users and PCU = peak concurrent users. These metrics are extremely important across the industry because they are used as a predictive tool to determine the revenues / earnings. By multiplying (number of ACU) X (the hourly rate that is charged for the game) X (# of hours in day) X (days in quarter) - it is possible to get meaningful revenue and earnings predictions.

One of the major reasons that the earnings surprise was to the negative on Thursday - was due to only 240,00 ACU. The9 had said as of initial launch in June that they had 250,000 ACU. Many of us made the logical assumption that the game would continue to grow in popularity - quickly hitting 300,000 or even 350,000 ACU by Q3 to become the most popular game in China. Instead the ACU actually fell by 10,000 to 240,000 from the initial launch. The company made several statements in the conference call that ACU was improving in October but I am skeptical.

2) Chinese Government: The government has enacted several harassing regulations that prevent users from playing the games more than 3 hours per day because the government feels that the games are detrimental to younger kids who should be studying. They also have enacted "cafe regulations" that put age limits on who can go to internet cafes to play videogames as many kids are too poor to have a computer and internet connection at home. Remember! - average income in China is still around $2,000 PER YEAR.
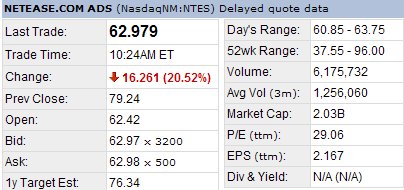
Predictive:

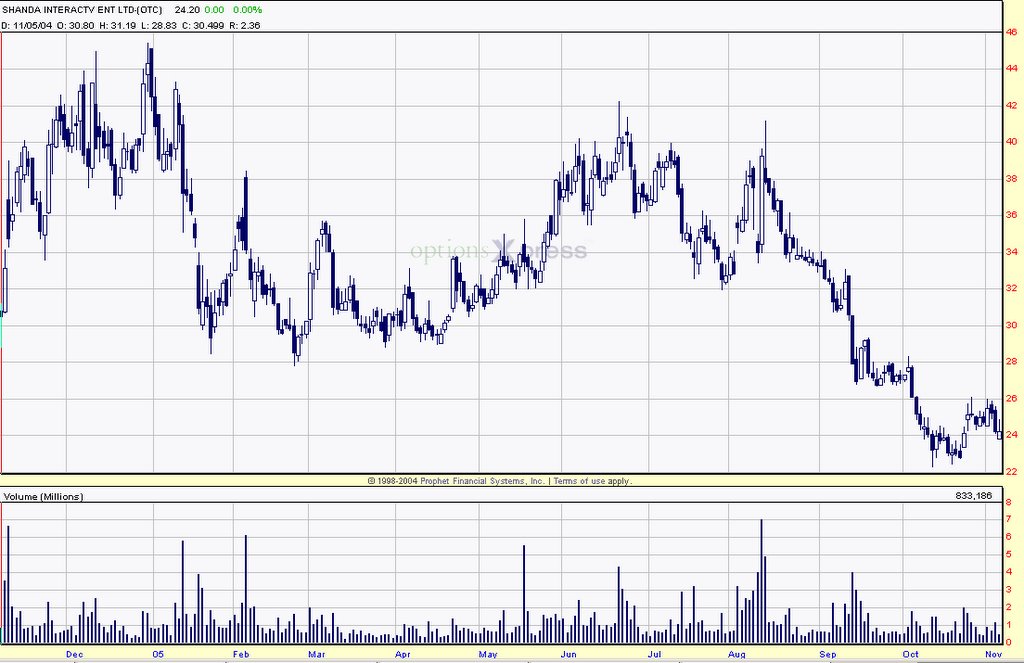
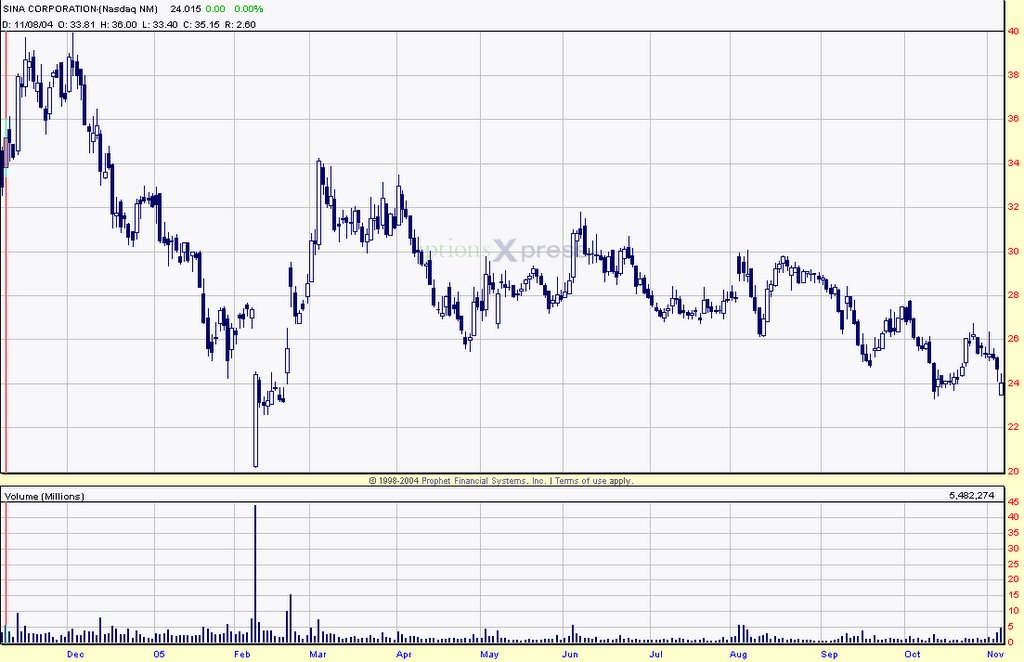
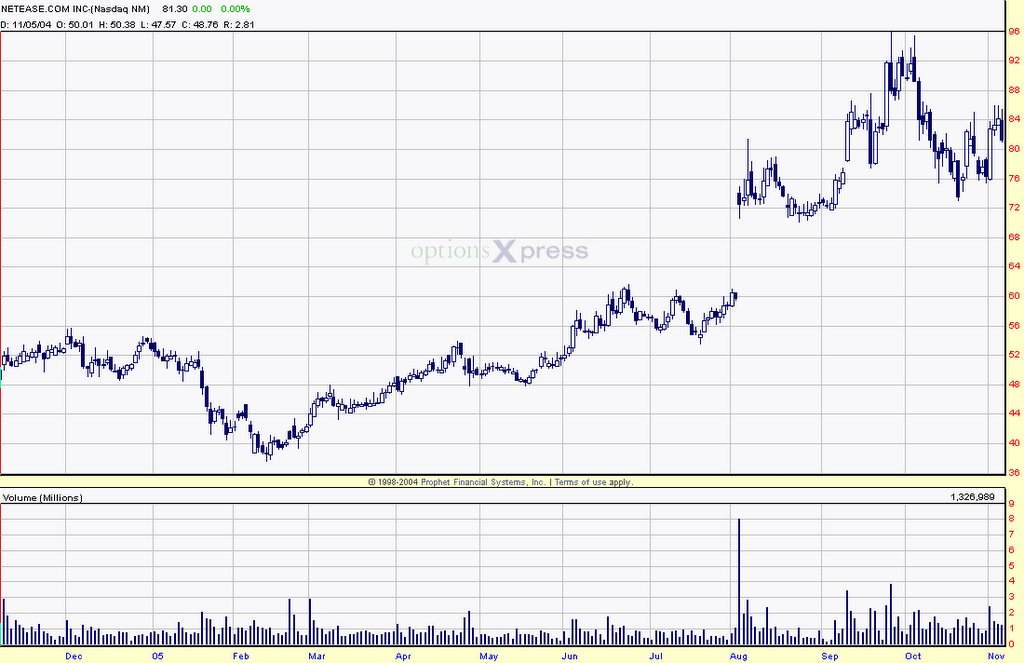
Sector is still in a downtrend. The commonly accepted leader (NTES) got nailed when it failed to report blockbuster earnings in Q3 that all had been betting on. I do think this sector is not ridiculously overvalued relative to some companies (re: Google) - especially when you consider the growth of Internet in China and the pure numbers they have going for them. Still is there is a ton of competition and more consolidation needs to take place before clearer winner emerges.


Conclusion:

I don't see any rush to buy this one or any of the other stocks in the Chinese Net sector. I don't think there is any clear winner right now and I would take this opportunity to WAIT and SEE. Why buy at $16 if you can buy in a month for $12.50 basically.

Additional notes:

I did not have time to listen to the Conference Call - but it is highly recommended for the value hounds who are looking at this as a longer term investment. Here is the link:

http://www.corp.the9.com/IR/sub_5.htm

Friday, November 11, 2005

Follow up on NCTY trade

It was a good call to get out in afterhours yesterday - there just should not have been any hesitation. ;) Still even though I knew instantly that I was not satisfied with the financial results - I figured that I would wait 30 minutes to see the market reaction in the after hours market. Most buyers/sellers reacted similar to me - other than a few suckers who could have bought from me at higher price! I don't know if there is any "lesson" from this one. But there are a few interesting points - 1) after setting a clear goal in terms of the financial results expected - when those are not met - it is not good to stick around in the stock "hoping," - you can always come back. and 2) be careful of the indicators that you use and your ability to sell even yourself on the story. I had believed that my analysis re: other stocks in the sector and also the positive price action during normal hours trading yesterday was bullish for NCTY. I also thought that low expectations were in the stock already - obviously not - as stock is down 10%+ today from yesterday's $18.50 close.

Re: longer term story unfolding at NCTY - I need a good few hours to go through the earnings report and also to read the 10-Q quarterly SEC filing when it comes out. Then I can do a more fundamental analysis on long term prospects, etc. Leaving it at that - here is the entry/exit, profit/loss, etc.

Profit/loss chart:


Entry/exit chart:

My timing and perception of value/market direction is not working right now. I will probably use this as another opportunity to back off a little bit. I will continue to track the following markets though -as I consider them key to understand the current rally: financials, interest rates, gold, the dollar, and government statistic - re: CPI, PPI, etc.

Best regards,

BG

Thursday, November 10, 2005

The back luck keeps up

Another tough break today with the NCTY results. It looks like things may be ok and trading may stabilize in trading tomorrow - but I did not want to take the risk as the actual earnings were much lower than I had expected - mainly due to a shortfall in revenues.

Still running with a lot of stuff goin on today - but hopefully this weekend - I will be able to give a review of if long-term view has changed or not. Also - I exited the trade in after hours at $16.90 for loss of $.90 per share ~ $400. I am dissapointed with my trade management because I had an opportunity to exit in after hours at much higher prices - re: 17.50+ even after the EPS news became public - but I hesitated. Still - it was good to take a loss when expectations did not match up to what I was looking for specifically.

Also - I should have a entry/exit chart and p/l detail tomorrow AM.

Here is the AH snapshot:

Regards,

BG

Took Position In Ncty - Now it is waiting game

Here is the portfolio snapshot. Took the NCTY position - now it is bit of waiting game - hopefully there are good EPS afterhours. I will give an update sometime this afternoon. Portfolio snapshot:

Regards,

BG

Wednesday, November 09, 2005

In a flash quick update

Basically - I am still having positive feedback from all elements of my tracking on NCTY. I plan on entering tomorrow. I can rationalize either higher or lower prices as OK tomorrow - but I prefer lower - :). I will post the final share count and how the earnings turn out tomorrow night and we can track the afterhours performance to see how much I lost or made....;) - we will see.

Regards,

BG

Tuesday, November 08, 2005

Runnin out of minutes big time

I wish I had more time this morning - but I don't - so this will be as quick as possible. One of The9.com's (NCTY) biggest competitors is getting nailed today. The name of the company is Netease and the symbol is (NTES). Here is the chart and the snapshot:


That folks - is what we call a GAP DOWN on major volume. Also getting killed this moring is Toll brothers (down 11%) - but I don't have time to post the chart and it is unrelated sector. Anyways - MotleyFool is out with a red alert on this one - buy NTES now - this is a great bargain, etc, etc. Maybe it, maybe it isn't - I haven't done the due diligence on NTES - but I will tell you this. In the NTES conference call yesterday they explicitly mentioned that their numbers and guidance was weaker due to increasing competition.

They also explicitly called this competition "World of Warcraft." That is the game that NCTY runs and I am making somewhat of a jump here and expecting better earnings for NCTY. The models that I have seen should put revenues around $30 M with EPS in the $0.35-0.45 range. I think that will be enough to move this one on Friday after earnings release is on Thursday night.

The good news for those like me who are optimistic is that NCTY is continuing to sell off in sympathy with the rest of the sector - down a little more than 1% today. I am going to continue to watch it and maybe. just maybe I can get in at high 16s or low 17s sometime on Wednesday or Thursday. I will be watching it - here is the chart:


That is the long and short of it. Well see what happens - hopefully broad market is weakening a bit here too - but it is unclear.

Regards,

BG

Saturday, November 05, 2005

What a week :)

Greetings! :) This has been a busy week. I have been writing a tax research paper for school that has been quite time-consuming. The analysis is quite interesting, but the statute that I was looking at turned out to be a lot older and require a lot more digging in the library than I had expected. Oh well..... It did give me some time though to have my mind wander a bit - so I have some new insights and hopefully you will find the following interesting.

Portfolio specific notes:

Portfolio is still getting trashed. The XLF hit all-time highs and my PUT options are basically worthless now and have less than 2-weeks till expiration meaning - very unlikely that they finish in the money. Gold is still getting crushed finishing around $455 this week. It looks like it could go as low $420 or even test the lower $400s due to the strong dollar and higher US interest rates. Here is the snapshot:


Planning on buying between 300 and 400 shares of NCTY pre-earnings. The other stocks in the Chinese Internet Sector (re: NTES, SNDA, SINA, SOHU), at least those that have reported so far have had mediocre releases. NTES is currently the strongest stock in the sector. Here are some of the related charts:


The9 (NCTY)


Shanda Interactivef (SNDA)


Sina.com (SINA)


Sohu.com (SOHU)


Netease (NTES)


Follow up notes - with the exception of NTES most of these stocks are below their 52 week average trading prices. I think it is interesting to compare the charts of SNDA and NCTY. SNDA was in a bidding war with NCTY for the World of Warcraft franchise and the marketing deal with Coca-Cola of China. The9 - although much smaller at the time - won World of Warcraft franchise first, and then the Coke contract.

Both are trading near 52 week lows, but it will be really interesting to watch both stocks reaction to Q3 earnings as both are direct competitors. SNDA is reporting on 11/9 and NCTY on 11/10. If SNDA has poor Q3 earnings it will be interested if NCTY rallies in response or also goes down. I don't really have any additional insight on this one at this point. We will know by next weekend what the story is for sure.

General Market Notes:

Market has had a great couple weeks here and looks like it could go higher - maybe in to 11K range if investors stay optimistic. This market action, especially the outperformance of two of the strongest sectors (re: Financials and Technology) have me extremely skeptical (as most readers know) in light of quickly rising interest rates. Given that I no longer have capital with which to bet on a decline in the price of either - I am going to just post a few charts of interest and continue to monitor the progress of both. At some point I expect a mean reversion. Whether that is next week or March though - I am not sure. :)

XLF Charts:


Interest Rates charts:


Bottom line is that the fundamentals (vis a vis earnings releases) and the economic data (re: government releases) still show a growing and healthy economy. Any sell-off in the markets so far has been mainly due to skepticisim about the sustainability of this growth and shaky guidance by some companies. As oil and gasoline prices continue to fall though, I could see this market retain its legs and make a further run.

Regards,

BG

Thursday, November 03, 2005

Keepin the focus real steady

Today the general trends continued. Bonds continued to sell off apparently in reaction to Greenspan's testimony re: the economy and interest rates. But on the flip side we had some nice moves in the market with the XLF hitting new highs and many of the more momentum type tech names continuing to ramp (re: Sandisk, Qualcomm, and Google).

There have also been some big bounces in the real estate related stocks (homebuilders, REITS, etc.) after being sold pretty hard the past couple weeks. I think the key thing to emphasize right now - is as far as we know the economic statistics as published and interpreted by the Government just aren't that bad. I personally consider the CPI numbers released last month quite alarming - but their appears to be a logical explanation there due to the momentary spike of oil to $70 and the refinery shortages post the hurricanes.

I think instead for the meantime investors and traders want to focus on what appear to be still good earnings numbers coming from many companies instead of thinking about what *could* happen with interest rates, the dollar, inflation, and a slowing economy.

I think the proof is in this chart right here:

Things to note:

1) Yields continue to rise across the board and quite rapidly
2) The fairly even rise across the different maturities

Main implications - as long as even the long maturities are being sold - healthy concerns regarding the economy are being voiced - mainly that the economy is growing and/or some inflation is out there - and interest rates are expected to be higher going out.

The only given that we have is that we "know" to some *degree* at least or maybe I should say - it is widely perceived that the Fed is going to take short term rates into the 4.5-4.75 range over the next 6 months. Now just by watching the longer term yields we should be able to get some feel for the strength of the economy. At a minimum we should be able to note investors expectations about the strength of the economy.

If longer term yields continue to rise then investors are not too concerned about growth and feel that growth/inflation will be sufficient to sustain higher interest rates. The flip side would be if investors see or expect slowing growth and begin to buy the longer-term bonds driving yields down. In that scenario where slow growth and low inflation is expected we could reach the flattened yield curve or inverted yield curve scenario that we last saw in 2000-2001. We know how that ended.........with a lot of pain.

But just as I was too early in making outlandish predictions of gloom and doom - stock market crash, etc. - it is probably too early to jump on the Bear bandwagon. The market will tell us by the moves in some of these key sectors that we are tracking.

Also of very important note - are the interrelationships - *sometimes* - a breakdown in a key variable - re: bond prices, exchange rates, commodities prices - may signal a major move to come in the equities markets. Often times though what is perceived to me to be a "significant" move is actually just noise. That is one reason I like to post these charts from Yahoo bonds - because they show not just the day-to-day trend but also the trailing month. This really helps to paint a picture of how far we have moved and how quickly.

That wraps up everything for tonight - I hope not too repetitive or unintelligible. I am going to try and add a link section to the site sometime in next day or two so that readers can see what sources I am reading weekly to help me get a feel for things. It may also be interesting to compare notes - as I have a feeling that my sources are heavily bearish. ;)

Regards,

BG

Q4 Rally is getting semi-official

It looks they are going to be able to manufacture the traditional Q4 rally this year despite the doubts. Even though interest rates are approaching 4 year highs - our tech favorites are killing it right now along with the financials. ;)

I think at this point you have to respect the move and see where it can take us. The financials hit an all-time high early this morning - here is the chart:

But here are the bond prices:

Do you notice a trend? In either? Here is the comparison chart again / updated of XLF v. TLT:

If you believe as I do that there is some correlation beteween the price movements of the two (the above is the longer term price patterns), then the shorterm term chart should be shouting:

Now here is the stumper - even if you think the move in the longer term treasuries is false and that yields will drop there when we see more inflation data - you have to concede somewhat that the Fed is probably going to take fed funds to 4.5 by January. Economists are currently putting that probability at about 90%. So even in the best case scenario - where longer term rates drop -we would be pretty much guaranteed a flat yield curve at minimum. I don't think that is priced into the XLF. Even if you think about it conceptually - the banks are coming off of the 3 best years in history practically. They originated more loans to more borrowers than ever. But that should already be priced in after Q3 earnings. I guess only time will tell how the effects of those lending practices and higher interst rates play out.

Bottom line: I don't have any juice left in the XLF and am done losing money there - but I will continue to track this divergence to see if I even had it close conceptually, over next few months. ;)

Also for those tech lovers out there:

Google hitting $385 earlier today and Sandisk - $64!!!!!!!!

Regards,

BG

Tuesday, November 01, 2005

Back at the last minute with some details

For once it was tough to get the motivation to post. Typically I can hardly wait to jot the thoughts down, but tonight I was feeling quite lethargic and an hour long talk with my sister was somewhat stressful and disheartening. Anyways...........I think I still have some insight re: bond yields and the current outlook.

Some important things happened today as the Fed tightened another quarter point and stuff is getting a bit clearer there with the yield curve picture. Here is the current table:

I think that we are seeing the spreads betwee long and short rates continue to compress and what is being heard out there right now is that is going to continue. One of the biggest calls being made by the big guns (including BCA research and Pimco) - they both know a little bit about bonds :) - they are both calling for falling long bond (re: 10/30 year) through the end of the year. Even in the face of the fed rate hikes and some potentially formidable CPI numbers coming?

We have a battle going on here between several parties and all have different intentions. We have the bond holders who believe that a recession will soon be upon us due to the Fed's aggressive tightening. They think the CPI numbers which have shown up huge over past few quarters are essentially red herrings becaus they think energy has falsely inflated the numbers and the CORE numbers are still looking great. (I am skeptical about this personally.)

Anyways the argument continues that the Fed is going to keep raising on the short term to 4.5% minimum. By the time they get there though - the economy should be slowing so much that inflation is going to be snuffed out completely and recession will already be beginning. From there on out longer term yields will be comparable to the short term yields (re: 4.5% or bellow) because bond investors don't need to be compensated on the longer end re: inflation, etc.

Now who is on the other side of this. I would say the Federal Reserve (at least by what they keep saying.) When multiple Fed Governors come out and make comments re: inflation fears after publicly stating earlier that long rates should be higher you have to feel they are really jawboning the bond markets. Other comments like bonds are priced for perfection and not enough credit risk premium is there, etc. also makes you think along those lines.

I guess another point of analysis - although I am not sure how it matches to these - is that inflation really is on the way and big time and it is showing up in the money supply. Even with 1/4 point raises in the fed funds - it is really doing nothing to slow the velocity of money and money supply has continued to expand over trailing 6 months. I don't have a clear answer here as I am already pushing the borders of my economics education - but makes sense to me that a big shakeout could be coming. Who is going to get it right - I am not sure.

The clearest and most vulnerable areas until things become clearer are the financials and anything related to discretionary spending in the economy - including unfortunately - housing. One possible explanation for the big move that we saw in the financials earlier this week and last week may have a lot to do with the first point of view. The goldilocks view may be that these miniscule rate hikes have really slowed things down and we need to just leave fed funds here for a month or two and then begin cutting again. Under that scenario we might see a healty yield curve manifest itself again and the Banks could go back to making money on the spread (the carry trade so to speak) and issuing mass amounts of ABS and MBS as usual.

I think this view is delusional - but some very smart people are calling it this way. The two biggest variables are:

1) What is really going on with inflation and
2) If inflation is really out there when are long-term bond investors going to start pricing that risk more rationally?
3) What is happening with the dollar?

If we can consider all of those and track the developments by watching the yield curve - I think we stand a chance. Not to necessarily - *predict* - anything - I don't believe that hype - but to keep tabs on what the setup is looking like so that we can track any major divergences as they are developing.

Now that we have gotten through all that BORING interest rate stuff.......we had a Q3 earnings release from a company called PDLI (Protein Design Labs). I have a few friends who follow this one closely and have made a boatload of money in it. It was down a few pennies in after hours - but I intend to spend some time focusing on this one when some more time frees up. They appear to have some really promising technologies and medicines.

I still have to come to jesus with some of their accounting procedures and reporting methodologies (re: GAAP and NON-GAAP discrepancies) before I feel comfortable making the plunge / plus the calculation of the possible dilution with two major convertibles offerings - but they are growing revenues quite nicely and appear to have some great things in the pipeline.

This will be next up after the NCTY speculation if I have any capital left at that point ;). Also fina final note (really) - I have corresponded with very reliable china internet investor earlier today re: NCTY and he has a much less rosy Q3 forecast. It is still good - but not the blockbuster I had expected and more or less in line with analysts forecasts. I am still buying sometime over next 7 days - but was not quite what I had expected and this guy is credible.

Anyways - best of luck to everyone finishing out this week - I will probably post less from here on out - but I am keeping an eye on things. :)

Regards,

BG